
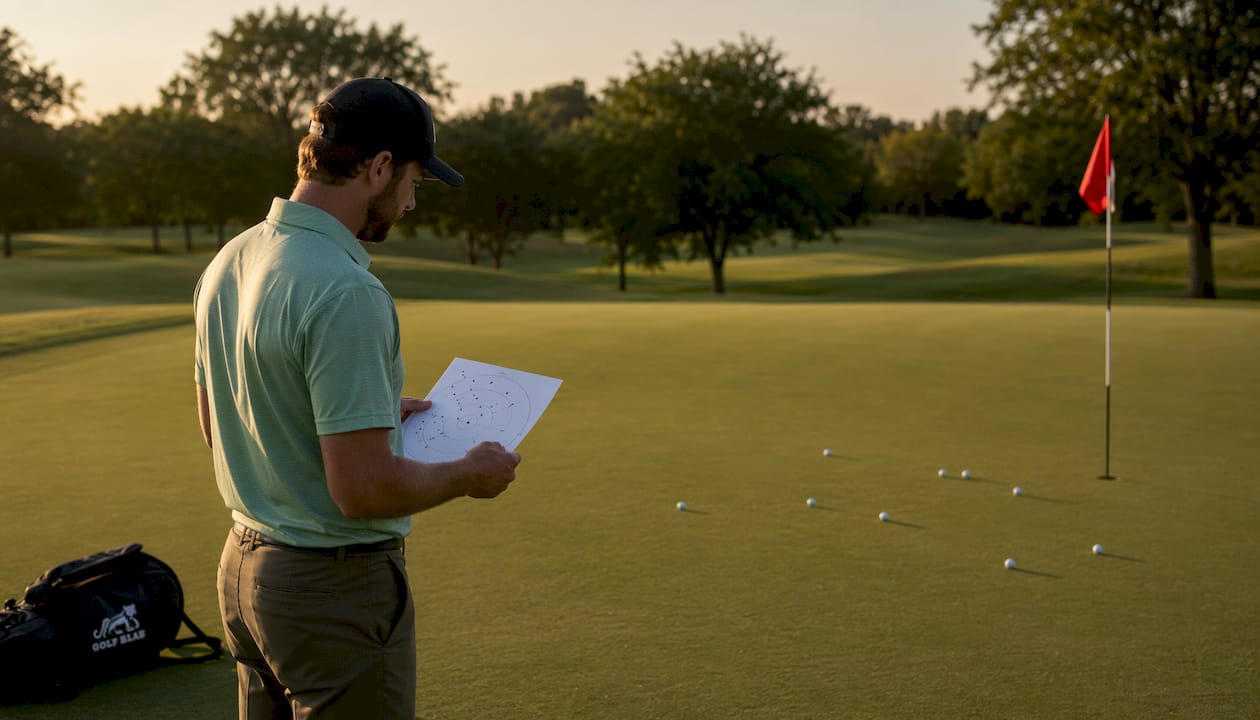
TL;DR:
- Golf shot dispersion measures how accurately and consistently your shots land around your target, especially in the lateral dimension. Reducing left/right scatter yields faster scoring improvements, and measuring 10–30 shots per club helps tailor your strategy. Improving contact quality and applying deliberate aim-off tactics can significantly tighten your dispersion pattern.
Golf shot dispersion is the size and shape of the scatter pattern your shots create around an intended target, measured in two dimensions: lateral (left/right) and longitudinal (short/long). Titleist defines it as a direct measure of accuracy and consistency, with a clear correlation between tighter proximity to the hole and lower scores.
TLDR:
- T5 Golf benchmarks show that PGA Tour players have a full-iron dispersion total width of 18–22 yards, while amateurs often see widths of 60–80 yards, indicating tighter patterns among the pros.
- Lateral scatter causes more penalty shots than longitudinal variance — reducing left/right spread yields faster scoring gains than adding distance.
- Measure 10–30 shots per club, plot the cloud, then aim away from trouble by at least half your measured lateral dispersion width.
- Golf Blab’s instructional resources and Play Golf with a Tour Pro experience offer structured paths to apply these insights on the course.
Table of Contents
- What does golf shot dispersion actually measure?
- How shot dispersion is measured
- Why dispersion matters for scoring and strategy
- Typical dispersion benchmarks by skill level and club
- What causes wide or asymmetric dispersion?
- How to test your dispersion on the range
- Drills and practice routines that tighten your pattern
- How equipment choices affect your dispersion
- How long does it take to improve, and what does it cost?
- What coaches and tour pros know about dispersion data
- Key Takeaways
- Why Golf Blab puts dispersion at the center of improvement
- Take your dispersion work further with Golf Blab
- Useful sources and further reading
What does golf shot dispersion actually measure?
Shot dispersion is best visualized as a cloud of dots on a map, each dot representing where one of your shots landed. The centroid is the center of that cloud — your average miss from the target. The mean miss tells you which direction you tend to err most consistently. Standard deviation quantifies how tightly those dots cluster: a small standard deviation means a compact, predictable cloud; a large one means shots scatter widely and unpredictably.
Lateral dispersion is the left-to-right width of that cloud, and it is the dimension that most directly drives penalty strokes and recovery situations. Longitudinal dispersion covers the depth of the cloud — how much your carry distance varies from shot to shot. Both dimensions matter, but they demand different fixes.

Carry distance and total distance are not interchangeable when mapping dispersion. Carry variance reflects your ball-striking consistency in the air; total distance adds roll, which varies with turf firmness and slope. For dispersion analysis, carry is the more reliable metric because it isolates your swing rather than the conditions underfoot. Impact location — where the ball contacts the face — is the primary mechanical input that shapes the cloud’s size and symmetry.
How shot dispersion is measured
The core metrics worth tracking are: centroid/mean miss, lateral width, longitudinal depth (carry variance), the 68% radius (one standard deviation circle), and the percentage of shots landing inside a defined target zone.

| Metric | What it tells you | How to collect it |
|---|---|---|
| Centroid/mean miss | Your average directional error | Average X and Y coordinates across all shots |
| Lateral width | Total left-to-right spread | Distance between leftmost and rightmost shots |
| Longitudinal depth | Carry distance variance | Longest carry minus shortest carry |
| 68% radius | Compact grouping size (1 SD) | Radius enclosing ~68% of shots around centroid |
| Target hit % | How often you land in a defined zone | Count shots inside zone ÷ total shots |
Manual plotting is a legitimate, low-cost alternative to launch-monitor data. Record landing coordinates for 10–20 consecutive shots per club, then plot them on graph paper or a spreadsheet to visualize the cloud. Phone apps like Arccos Caddie and Shot Scope V5 automate coordinate capture during rounds. Radar-based shot-tracking technology such as FlightScope Mevo+ or Trackman provides the most granular data — carry, spin, launch angle, and face-to-path numbers — but a session costs $50–$150 at most U.S. fitting centers.
A minimum of 10 shots per club produces a usable pattern. Twenty shots gives you a statistically more stable cloud, and 30 is the gold standard for any club you rely on heavily under pressure. Consistent conditions matter: same ball, same tee height for driver, similar temperature, and no wind gusts mid-session.
Pro Tip: Run your dispersion test on a calm morning before fatigue sets in. Tired swings widen the cloud artificially and skew your baseline.
Why dispersion matters for scoring and strategy
Lateral misses are the primary generator of penalty strokes and unplayable lies. A shot that finishes 20 yards short of the green still leaves a chip; a shot that finishes 20 yards right of the green may find a bunker, water, or out-of-bounds. That asymmetry is why reducing left/right scatter typically yields faster scoring improvements than chasing extra distance.
Longitudinal inconsistency carries its own quiet cost. If your 7-iron carry varies by 15 yards from swing to swing, you will miss greens even when your direction is perfect. Coaching guidance consistently points to club selection as the first lever to pull when you are consistently short — before overhauling mechanics. Choosing a 6-iron when your 7-iron pattern runs short is a faster fix than rebuilding your swing on the range.
The aiming strategy that flows from dispersion data is straightforward: treat your shot cloud as a target zone, not a single point. If your measured lateral dispersion is 30 yards wide, your centroid needs to sit at least 15 yards away from any hazard boundary to keep the worst-case miss in play. Pair this with the golf strategy tips that account for your known miss, and you will find more fairways and greens without changing a single thing about your swing.
Pro Tip: If your average miss is 10 yards right, aiming at the center of the green is suboptimal. Aim at the left edge and let your natural pattern work with you, not against you.
Typical dispersion benchmarks by skill level and club
Dispersion ranges vary widely by handicap and club type. The figures below reflect typical patterns under controlled range conditions; on-course numbers tend to run wider due to pressure, uneven lies, and wind.
| Player level | Full iron (total lateral width) | Driver (total lateral width) |
|---|---|---|
| PGA Tour | 18–22 yards | 30–40 yards |
| Scratch to 5 handicap | 30 yards | 45 yards |
| 6–15 handicap | 45 yards | 60–90 yards |
| 16+ handicap | 60–80 yards | 80 yards |
These ranges align with T5 Golf’s benchmark data and carry important caveats. Driver dispersion is almost always wider than iron dispersion for the same player because the longer shaft amplifies small face-angle errors at impact. Short irons and wedges produce the tightest clouds because the shaft is shorter and the loft is higher, which reduces the effect of face-angle variation on curvature.
Handicap correlates with grouping size, but it is not a perfect predictor. A 12-handicapper with a consistent swing path but poor distance control may have a narrow lateral cloud and a wide longitudinal one. Wind, fatigue, and turf firmness all widen the cloud temporarily, so interpret benchmarks conservatively and test under calm conditions before drawing conclusions.
What causes wide or asymmetric dispersion?
Most dispersion problems trace back to one of five root causes, and identifying which one applies to your pattern is the fastest path to a targeted fix.
- Off-center contact: Toe or heel strikes change both direction and distance unpredictably. This is the single most common cause of wide clouds in amateur golfers.
- Inconsistent face angle at impact: Even a 2-degree open face at impact sends the ball measurably right of the path. Small face-angle variations compound across a session.
- Swing path faults: An over-the-top path combined with a compensating face angle creates a pattern that clusters on one side but with variable depth.
- Improper club selection: Using a club that demands a near-perfect swing to reach the target forces you to swing harder, which widens the pattern.
- Equipment mismatch: A shaft that is too light or too flexible for your swing speed can amplify timing errors, widening lateral scatter. Research on shot type confirms that fade and draw tendencies interact with spin rates and distance efficiency, meaning your natural shot shape affects how your equipment should be fitted.
Ask yourself two diagnostic questions. Do your misses cluster consistently on the same side? If yes, face angle or path is the likely culprit. Does your distance vary wildly even when direction is acceptable? If yes, contact quality or shaft flex is the more probable driver. When misses are random in both dimensions, a fitting session or a lesson with video analysis will surface the cause faster than self-diagnosis.
How to test your dispersion on the range
A reproducible protocol produces data you can actually trust and compare over time.
- Set up a consistent target. Use a flagstick, alignment stick, or range marker at a known distance. Record the distance.
- Choose one club and one ball model. Mixing equipment mid-session contaminates the data.
- Note environmental conditions. Wind speed and direction, temperature, and turf type all affect carry. A quick phone-weather check takes 30 seconds.
- Hit 20–30 shots with your full pre-shot routine. Treat each shot as a real on-course attempt — no quick-fire range mode.
- Mark or record each landing point. Use a phone app, a launch monitor, or a simple grid drawn on paper with pacing distances.
- Calculate your centroid. Average the left/right offset of all shots. Average the short/long offset separately.
- Compute a simple 68% radius. Remove the three widest outliers, then find the radius that encloses the remaining cluster. That radius is your working dispersion for that club.
- Repeat after 1–2 weeks using the same protocol to measure whether your cloud has shifted or tightened.
For a quick manual calculation: if your 10 lateral offsets are 5R, 8R, 2L, 10R, 3R, 6R, 1L, 7R, 4R, and 9R (in yards), your mean miss is 4.9 yards right. That is your centroid. The spread from 2L to 10R gives a total lateral width of 12 yards — a compact pattern for a mid-handicapper.
Pro Tip: Photograph your landing zone from above using a drone app or ask a friend to mark shots with tees while you hit. A visual scatter map reveals asymmetry that numbers alone can obscure.
Drills and practice routines that tighten your pattern
Center-face contact is the primary mechanical driver of tighter dispersion, and FlightScope’s coaching guidance is unambiguous on this point: chasing aesthetic swing changes before solving contact quality is working in the wrong order. The drills below address contact first, then distance control.

Drill 1: Foot-spray impact tape. Apply foot-spray or impact tape to the face before each swing. The residue mark reveals exactly where the ball contacted the face. Hit 10 shots, check the pattern, and adjust ball position or grip pressure to move the cluster toward center. This drill alone, practiced over two or three sessions, often produces a measurable reduction in lateral width.
Drill 2: Gate drill for path. Place two alignment sticks or tees just wider than the clubhead, forming a gate through which the club must travel at impact. A path fault that causes consistent left or right misses will be immediately exposed. Ten minutes of gate work per session builds the proprioceptive feedback that translates to tighter patterns on the course.
Drill 3: Distance ladder for longitudinal control. Hit five shots each to targets at 80%, 90%, and 100% of your full carry distance with the same club. The goal is to land within 5 yards of each target. This trains tempo and grip pressure rather than swing mechanics, and it directly addresses longitudinal scatter.
A 30-shot practice routine:
- Shots 1–5: Warm-up with half-swings, focusing on center contact.
- Shots 6–15: Foot-spray drill, full swings, checking impact location after each shot.
- Shots 16–22: Gate drill, full swings, path awareness.
- Shots 23–28: Distance ladder, three targets, five shots each.
- Shots 29–30: Validation shots with no feedback tools — trust the pattern.
Record your centroid and 68% radius after each session. If lateral width has not narrowed after four sessions, escalate to a lesson or a fitting. The shot-shaping fundamentals that underpin these drills are worth studying alongside your dispersion data.
How equipment choices affect your dispersion
Equipment does not fix a fundamentally inconsistent swing, but it can meaningfully reduce scatter for players whose mechanics are reasonably sound. The most impactful variables are shaft weight, loft, and ball spin characteristics.
- Shaft weight: Heavier shafts (60–70g+) can tighten dispersion for players who need more stability through the hitting zone. Lighter shafts (40–50g) increase swing speed and launch but may widen the pattern for players with fast, aggressive transitions.
- Loft adjustments: Adding loft to a driver reduces side spin, which narrows the lateral cloud. Most modern adjustable drivers allow 1.5–2 degrees of loft change without a fitting appointment.
- Ball spin: A lower-spin ball reduces the curvature of off-center strikes, effectively narrowing the lateral cloud for players who generate high spin. Higher-spin balls reward precise contact but punish mishits more severely.
- Clubhead size: Larger driver heads (460cc) offer a larger sweet spot, which reduces the distance penalty on off-center strikes and moderates lateral scatter.
- Fitting timing: Pursue a fitting when your dispersion test shows a consistent directional bias that drills have not resolved after 4–6 weeks of focused practice.
A fitting session at a U.S. facility typically involves a fee and includes launch-monitor data across multiple shaft and head combinations, with prices varying by location. That investment often surfaces a shaft weight or flex mismatch that no amount of practice can compensate for. Clubhead speed is a related variable worth understanding — Golf Blab’s clubhead speed guide explains how speed interacts with shaft selection and distance control.
How long does it take to improve, and what does it cost?
Realistic timelines depend on whether the problem is mechanical, equipment-driven, or strategic. A strategic fix — adjusting your aiming point based on your measured centroid — can lower scores immediately, with no practice required. A mechanical fix, such as improving center-face contact through the foot-spray drill, typically produces measurable dispersion improvement within 4–8 weeks of consistent, focused practice (two to three range sessions per week).
Equipment changes from a fitting can shift your pattern within a single session, though the improvement consolidates over several rounds as you adapt to the new feel. Expect 2–4 weeks before the new equipment’s benefit is fully reflected in your dispersion data.
Typical U.S. costs for dispersion-related work:
- Launch-monitor session (no fitting): $50–$150 per hour at most U.S. golf facilities.
- Club fitting: $50–$200, often credited toward equipment purchase.
- Single lesson with a PGA professional: $75–$200 depending on market and instructor credentials.
For golfers on a budget, manual plotting costs nothing beyond a notepad and 30 minutes. A targeted single lesson focused specifically on impact location is the highest-leverage paid investment for most mid-handicappers. Golf Blab’s lesson cost guide breaks down how to find genuine value without overpaying.
What coaches and tour pros know about dispersion data
Experienced coaches read a dispersion cloud the way a physician reads an X-ray — the shape of the pattern tells them more than any single shot. A cloud that is wide laterally but compact longitudinally points to face-angle inconsistency. A cloud that is narrow laterally but stretched longitudinally suggests tempo or grip-pressure variation. When the centroid sits consistently right of center, the coach knows the player is either aiming incorrectly or has a systematic path or face issue that practice alone will not resolve.
The “aim-off” rule is one of the most practically powerful insights in course management: treat your dispersion cloud as a target zone and position the centroid at least half your lateral width away from any hazard. A player with a 40-yard lateral cloud should never aim within 20 yards of a boundary. This single adjustment, applied consistently, can save two to three strokes per round without changing anything about the swing.
FlightScope’s coaching data reinforces that practicing center-face contact is more reliable than chasing swing aesthetics. Coaches who work with dispersion data routinely find that a player’s cloud tightens dramatically once impact location becomes consistent, even when the swing’s visual shape remains unchanged.
Pro Tip: Combine your dispersion knowledge with shot-shaping awareness. A player who knows their natural miss is right and can intentionally shape a draw has two tools working together — the shaped shot reduces the rightward centroid, and the aim-off rule protects against the occasional straight ball.
Golf Blab’s educational content is built around exactly this kind of layered, data-informed improvement. The golf performance indicators guide connects dispersion to broader scoring metrics, giving you a fuller picture of where your game gains are hiding.
Key Takeaways
Tighter lateral dispersion, measured over 20–30 shots per club and applied through deliberate aim-off strategy, is the fastest route to lower scores for most recreational golfers.
| Point | Details |
|---|---|
| Define your cloud | Measure 20–30 shots per club; track lateral width, longitudinal depth, and centroid separately. |
| Lateral scatter costs most | Reducing left/right spread yields faster scoring gains than adding distance or fixing direction alone. |
| Aim off deliberately | Position your centroid at least half your lateral dispersion width away from any hazard or boundary. |
| Contact quality first | Center-face contact, trained through impact tape and gate drills, is the primary driver of a tighter pattern. |
| Golf Blab resources | Use Golf Blab’s lessons and Play Golf with a Tour Pro to apply dispersion insights with professional guidance. |
Why Golf Blab puts dispersion at the center of improvement
There is something deeply satisfying about watching a shot cloud shrink over weeks of deliberate practice — it is one of the few metrics in golf that makes improvement visible and undeniable. At Golf Blab, the conviction is that golfers improve fastest when education and equipment work together: understanding your pattern, then equipping yourself to act on it. The instructional content here is designed to give you the analytical framework, and the products, from personalized club labels that make your equipment feel truly yours to professional playing experiences, are designed to keep you engaged with the process long enough for real change to take hold.
Take your dispersion work further with Golf Blab
Knowing your shot cloud is only half the equation. The other half is having the right support to act on it. Golf Blab’s Play Golf with a Tour Pro experience puts you on the course alongside a professional who can read your pattern in real time and offer adjustments that a range session alone cannot replicate. For golfers who want to mark the start of a more intentional practice chapter, Golf Blab’s custom golf club labels let you personalize the clubs you are now tracking with precision — a small, meaningful way to own the process. And if you are ready to book structured instruction with a money-back guarantee, Golf Blab’s online lessons offer a low-risk path to professional feedback. Browse the full range at Golf Blab and find the resource that fits where you are in your game right now.
Useful sources and further reading
- Titleist: Golf Shot Dispersion — The manufacturer’s authoritative definition linking dispersion to scoring, covering both lateral and longitudinal components.
- T5 Golf: What Is Shot Dispersion? — The most comprehensive benchmark data available, including amateur vs. tour pro dispersion widths and manual plotting protocols.
- CaddieHQ: What Is Shot Dispersion? — Clear definitions of lateral vs. longitudinal dispersion and practical coaching insights on club selection.
- FlightScope: Using Shot Dispersion Data — Instructor-backed guidance on center-face contact as the primary lever for tightening groupings.
- Journal of Kinesiology: Shot Type and Dispersion — Academic research on how fade and draw tendencies affect spin rates and distance efficiency, with direct implications for dispersion patterns.
- Bogey Buster Golf Shafts: Shaft Weight and Swing — Practical guidance on how shaft weight affects stability and dispersion for different swing profiles.
- Golf Blab: Golf Shot Tracking Explained — An overview of tracking technologies and apps that support dispersion measurement.
- Golf Blab: Golf Target Setting Tips — Practical aim-off strategies that translate dispersion data into on-course decisions.